 EMODnet Product Catalogue
Litter abundance and type
Type of resources
Available actions
Topics
Keywords
Contact for the resource
Provided by
Years
Representation types
-
This dataset includes data of plastic litter collected by citizens and students during 12 campaigns that were organised in Crete (Greece) during the period May 2022 – May 2023. The campaigns were organized within the framework of the NAUTILOS Horizon 2020 project. More specifically the number of plastic litter items per category (using the J code List of the EMODnet Chemistry Thematic Lot n°4) was recorded together with information about the location, date, surface area covered, data contributor and some environmental characteristics (sediment, weather, surroundings).
-
Dataset gives a baseline for micro- and mesoplastic pollution distribution in 24 beaches along the Latvian coastline (Northern Europe, Baltic states), filling the existing knowledge gap and contributing to the global understanding of microplastic particles presence, transport, and the processes governing its dynamics. We also highlight citizen science as a fundamental tool to support data collection and raise awareness about microplastic pollution, as samples were collected by up to 250 volunteers during organized campaigns (Dimante-Deimantovica et al. 2023).
-
This visualization product displays the spatial distribution of plastic bags density per trawl. EMODnet Chemistry included the collection of marine litter in its 3rd phase. Since the beginning of 2018, data of seafloor litter collected by international fish-trawl surveys have been gathered and processed in the EMODnet Chemistry Marine Litter Database (MLDB). The harmonization of all the data has been the most challenging task considering the heterogeneity of the data sources, sampling protocols (OSPAR and MEDITS protocols) and reference lists used on a European scale. Moreover, within the same protocol, different gear types are deployed during fishing bottom trawl surveys. In cases where the wingspread and/or number of items were unknown, data could not be used because these fields are needed to calculate the density. Data collected before 2011 are affected by this filter. When the distance reported in the data was null, it was calculated from: - the ground speed and the haul duration using this formula: Distance (km) = Haul duration (h) * Ground speed (km/h); - the trawl coordinates if the ground speed and the haul duration were not filled in. The swept area is calculated from the wingspread (which depends on the fishing gear type) and the distance trawled: Swept area (km²) = Distance (km) * Wingspread (km) Densities have been calculated on each trawl and year using the following computation: Density of plastic bags (number of items per km²) = ∑Number of plastic bags related items / Swept area (km²) Then a grid with 30km x 30km cells is used to calculate the weighted mean of densities in each cell from the formula : Weighted mean (number of items per km²) = ∑ (Distance (km) * Density (number of items per km²)) / ∑ Distance (km) Percentiles 50, 75, 95 & 99 have been calculated taking into account data for all years. More information on data processing and calculation are detailed in the document attached. Warning: the absence of data on the map doesn't necessarily mean that they don't exist, but that no information has been entered in the Marine Litter Database for this area. This work is based on the work presented in the following scientific article: O. Gerigny, M. Brun, M.C. Fabri, C. Tomasino, M. Le Moigne, A. Jadaud, F. Galgani, Seafloor litter from the continental shelf and canyons in French Mediterranean Water: Distribution, typologies and trends, Marine Pollution Bulletin, Volume 146, 2019, Pages 653-666, ISSN 0025-326X, https://doi.org/10.1016/j.marpolbul.2019.07.030.
-

This visualization product displays the spatial distribution of fishing related items density per trawl. EMODnet Chemistry included the collection of marine litter in its 3rd phase. Since the beginning of 2018, data of seafloor litter collected by international fish-trawl surveys have been gathered and processed in the EMODnet Chemistry Marine Litter Database (MLDB). The harmonization of all the data has been the most challenging task considering the heterogeneity of the data sources, sampling protocols (OSPAR and MEDITS protocols) and reference lists used on a European scale. Moreover, within the same protocol, different gear types are deployed during fishing bottom trawl surveys. In cases where the wingspread and/or number of items were unknown, data could not be used because these fields are needed to calculate the density. Data collected before 2011 are affected by this filter. When the distance reported in the data was null, it was calculated from: - the ground speed and the haul duration using this formula: Distance (km) = Haul duration (h) * Ground speed (km/h); - the trawl coordinates if the ground speed and the haul duration were not filled in. The swept area is calculated from the wingspread (which depends on the fishing gear type) and the distance trawled: Swept area (km²) = Distance (km) * Wingspread (km) Densities have been calculated on each trawl and year using the following computation: Density of fishing related items (number of items per km²) = ∑Number of fishing related items / Swept area (km²) Then a grid with 30km x 30km cells is used to calculate the weighted mean of densities in each cell from the formula : Weighted mean (number of items per km²) = ∑ (Distance (km) * Density (number of items per km²)) / ∑ Distance (km) Percentiles 50, 75, 95 & 99 have been calculated taking into account data for all years. More information on data processing and calculation are detailed in the document attached. Warning: the absence of data on the map doesn't necessarily mean that they don't exist, but that no information has been entered in the Marine Litter Database for this area. This work is based on the work presented in the following scientific article: O. Gerigny, M. Brun, M.C. Fabri, C. Tomasino, M. Le Moigne, A. Jadaud, F. Galgani, Seafloor litter from the continental shelf and canyons in French Mediterranean Water: Distribution, typologies and trends, Marine Pollution Bulletin, Volume 146, 2019, Pages 653-666, ISSN 0025-326X, https://doi.org/10.1016/j.marpolbul.2019.07.030.
-
This visualization product displays the number of non-MSFD monitoring surveys, research & cleaning operations and the associated temporal coverage per beach. EMODnet Chemistry included the collection of marine litter in its 3rd phase. Since the beginning of 2018, data of beach litter have been gathered and processed in the EMODnet Chemistry Marine Litter Database (MLDB). The harmonization of all the data has been the most challenging task considering the heterogeneity of the data sources, sampling protocols and reference lists used on a European scale. Preliminary processing were necessary to harmonize all the data: - Exclusion of OSPAR 1000 protocol: in order to follow the approach of OSPAR that it is not including these data anymore in the monitoring; - Selection of surveys from non-MSFD monitoring, cleaning and research operations; - Exclusion of beaches without coordinates. More information is available in the attached documents. Warning: the absence of data on the map doesn't necessarily mean that they don't exist, but that no information has been entered in the Marine Litter Database for this area.
-
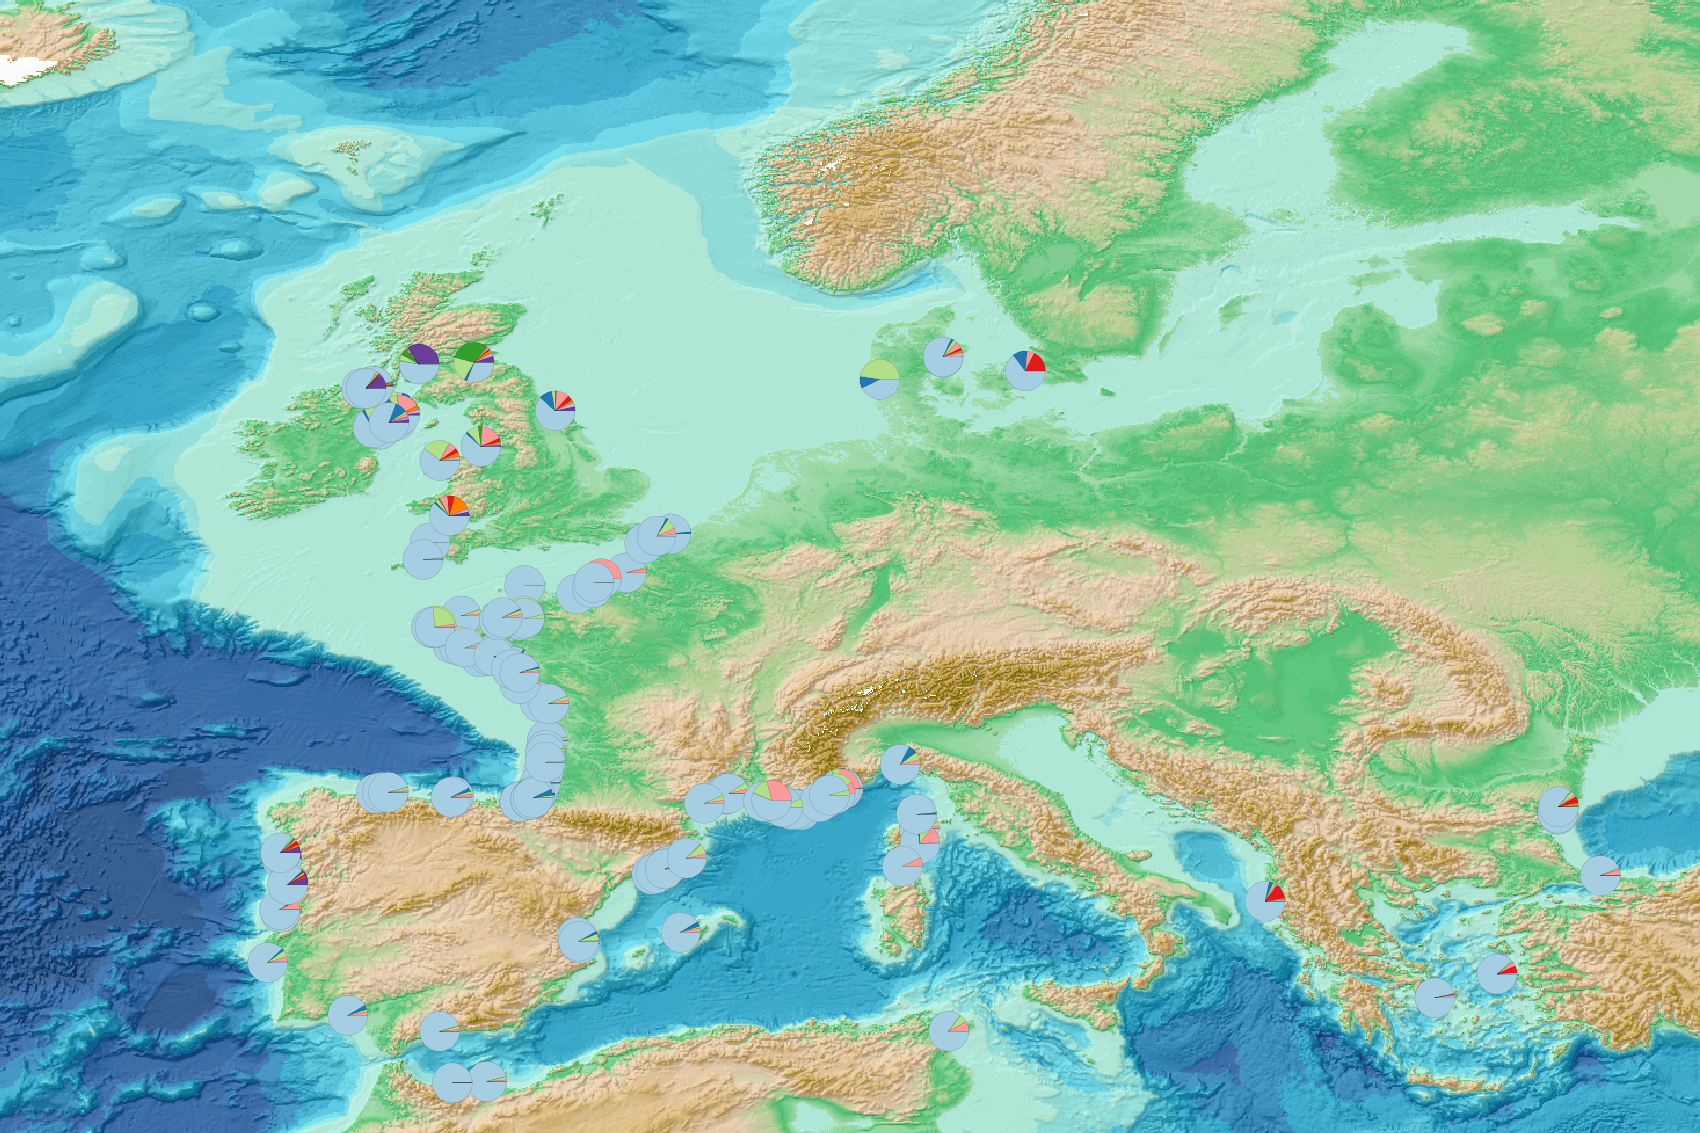
This visualization product displays marine macro-litter (> 2.5cm) material categories percentage per beach per year from non-MSFD monitoring surveys, research & cleaning operations. EMODnet Chemistry included the collection of marine litter in its 3rd phase. Since the beginning of 2018, data of beach litter have been gathered and processed in the EMODnet Chemistry Marine Litter Database (MLDB). The harmonization of all the data has been the most challenging task considering the heterogeneity of the data sources, sampling protocols and reference lists used on a European scale. Preliminary processing were necessary to harmonize all the data: - Exclusion of OSPAR 1000 protocol: in order to follow the approach of OSPAR that it is not including these data anymore in the monitoring; - Selection of surveys from non-MSFD monitoring, cleaning and research operations; - Exclusion of beaches without coordinates; - Exclusion of surveys without associated length; - Some litter types like organic litter, small fragments (paraffin and wax; items > 2.5cm) and pollutants have been removed. The list of selected items is attached to this metadata. This list was created using EU Marine Beach Litter Baselines and EU Threshold Value for Macro Litter on Coastlines from JRC (these two documents are attached to this metadata); - Exclusion of the "feaces" category: it concerns more exactly the items of dog excrements in bags of the OSPAR (item code: 121) and ITA (item code: IT59) reference lists; - Normalization of survey lengths to 100m & 1 survey / year: in some case, the survey length was not 100m, so in order to be able to compare the abundance of litter from different beaches a normalization is applied using this formula: Number of items (normalized by 100 m) = Number of litter per items x (100 / survey length) Then, this normalized number of items is summed to obtain the total normalized number of litter for each survey. To calculate percentages for each material category, formula applied is: Material (%) = (∑number of items (normalized at 100 m) of each material category)*100 / (∑number of items (normalized at 100 m) of all categories) The material categories differ between reference lists (OSPAR, TSG_ML, UNEP, UNEP_MARLIN). In order to apply a common procedure for all the surveys, the material categories have been harmonized. More information is available in the attached documents. Warning: the absence of data on the map doesn't necessarily mean that they don't exist, but that no information has been entered in the Marine Litter Database for this area.
-
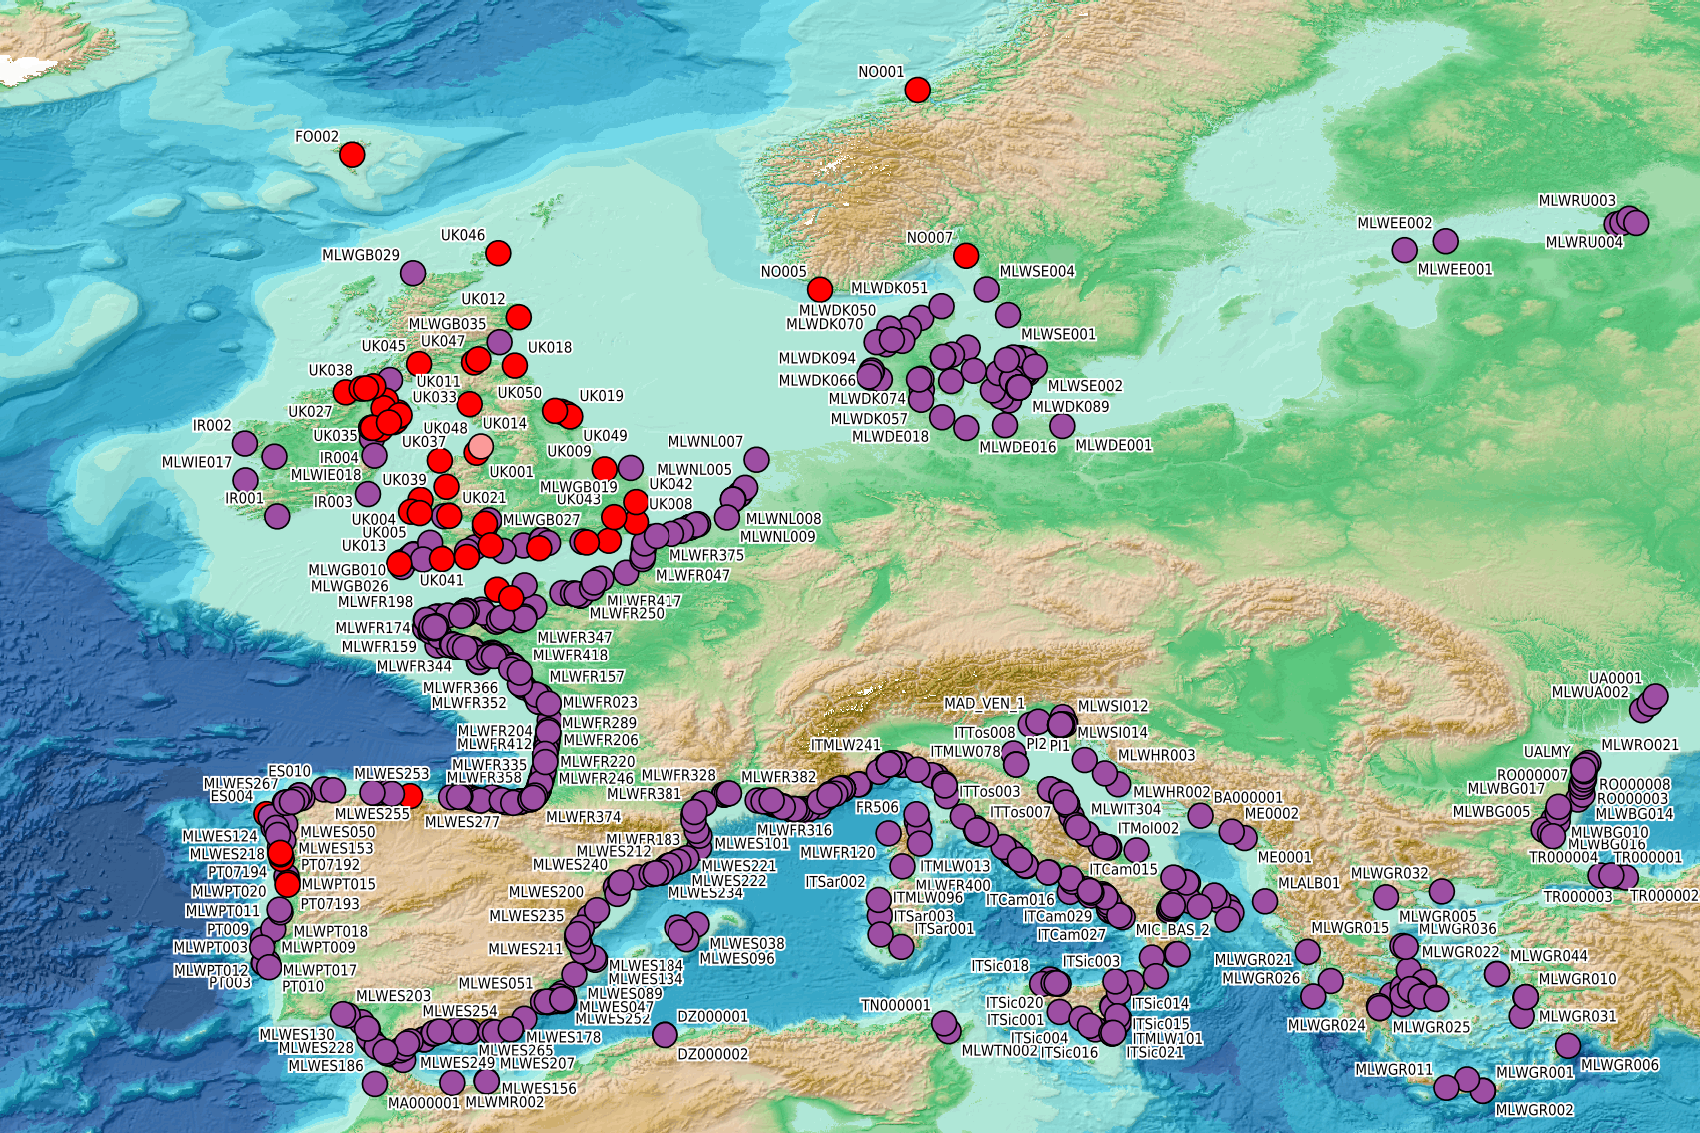
This visualization product displays beaches locations where non-MSFD monitoring surveys, research & cleaning operations have been applied to collate data on macrolitter (> 2.5 cm). Reference lists associated with these protocols have been indicated with different colors in the map. EMODnet Chemistry included the collection of marine litter in its 3rd phase. Since the beginning of 2018, data of beach litter have been gathered and processed in the EMODnet Chemistry Marine Litter Database (MLDB). The harmonization of all the data has been the most challenging task considering the heterogeneity of the data sources, sampling protocols and reference lists used on a European scale. Preliminary processing were necessary to harmonize all the data: - Exclusion of OSPAR 1000 protocol: in order to follow the approach of OSPAR that it is not including these data anymore in the monitoring; - Selection of surveys from non-MSFD monitoring, cleaning and research operations; - Exclusion of beaches without coordinates; - Some categories & some litter types like organic litter, small fragments (paraffin and wax; items > 2.5cm) and pollutants have been removed. The list of selected items is attached to this metadata. This list was created using EU Marine Beach Litter Baselines and EU Threshold Value for Macro Litter on Coastlines from JRC (these two documents are attached to this metadata). More information is available in the attached documents. Warning: the absence of data on the map doesn't necessarily mean that they don't exist, but that no information has been entered in the Marine Litter Database for this area.
-
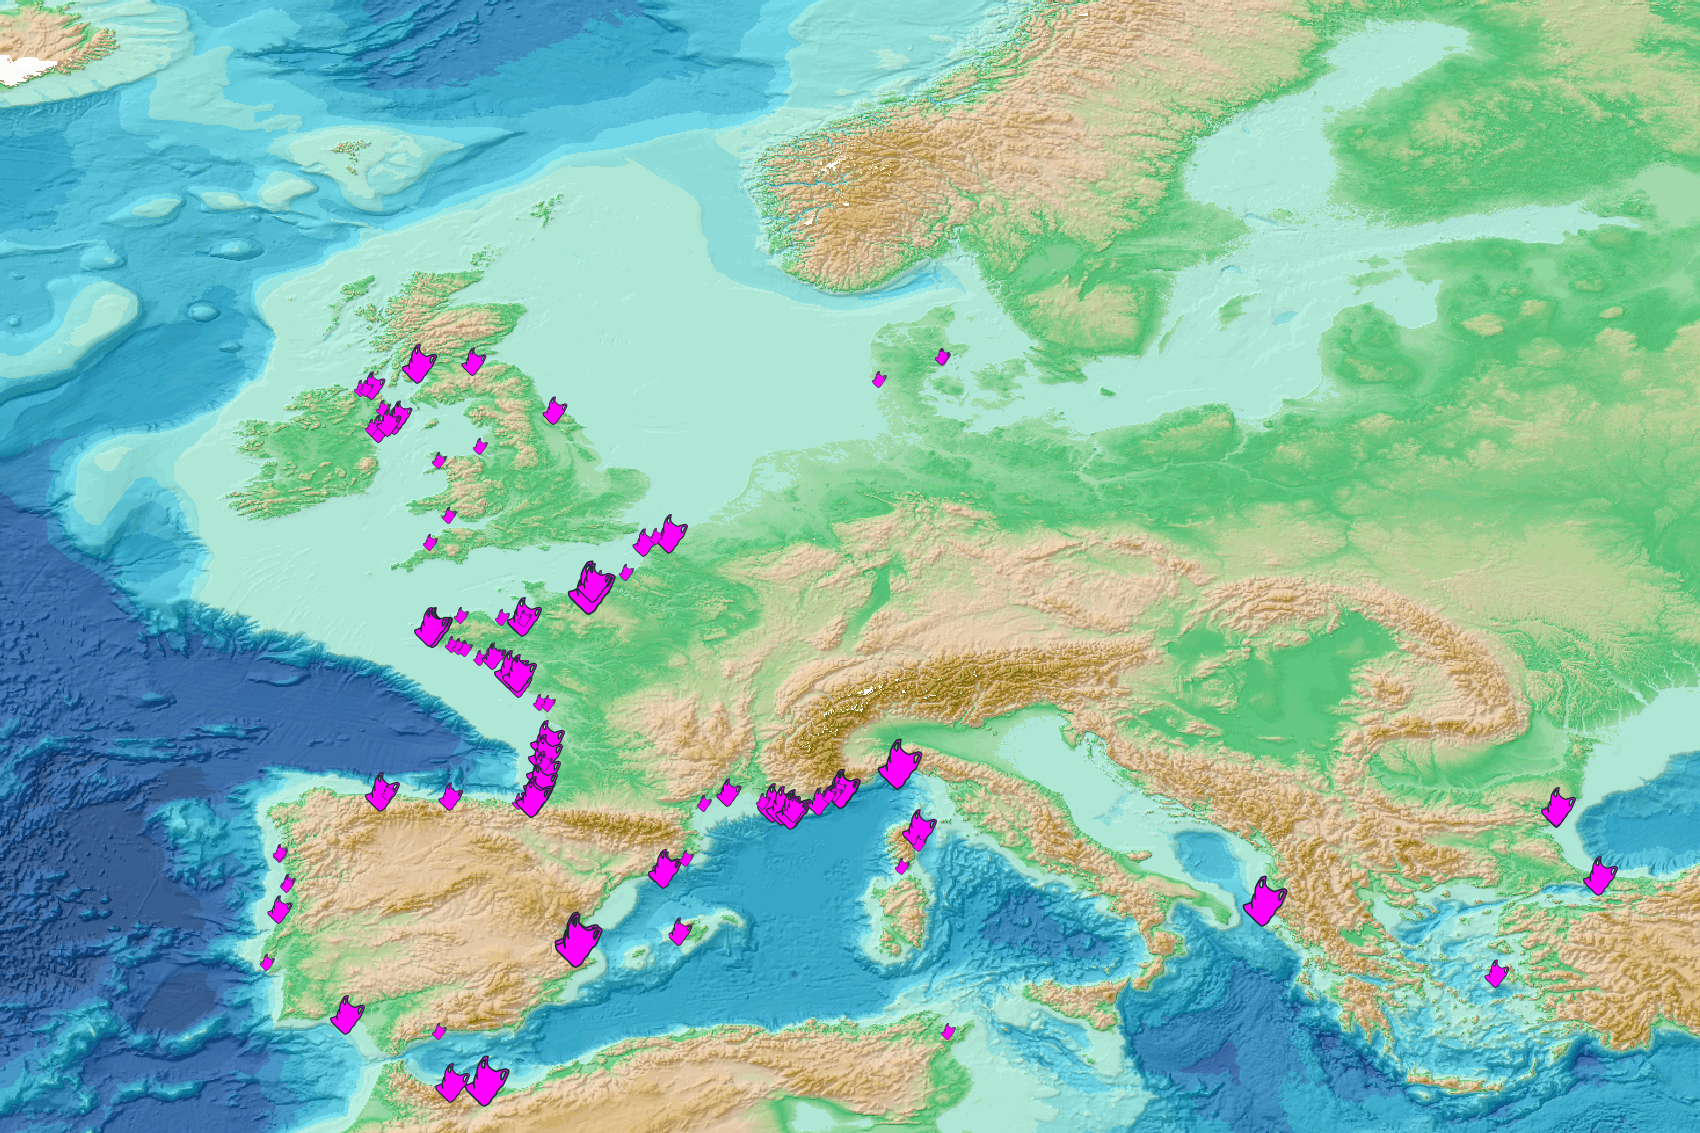
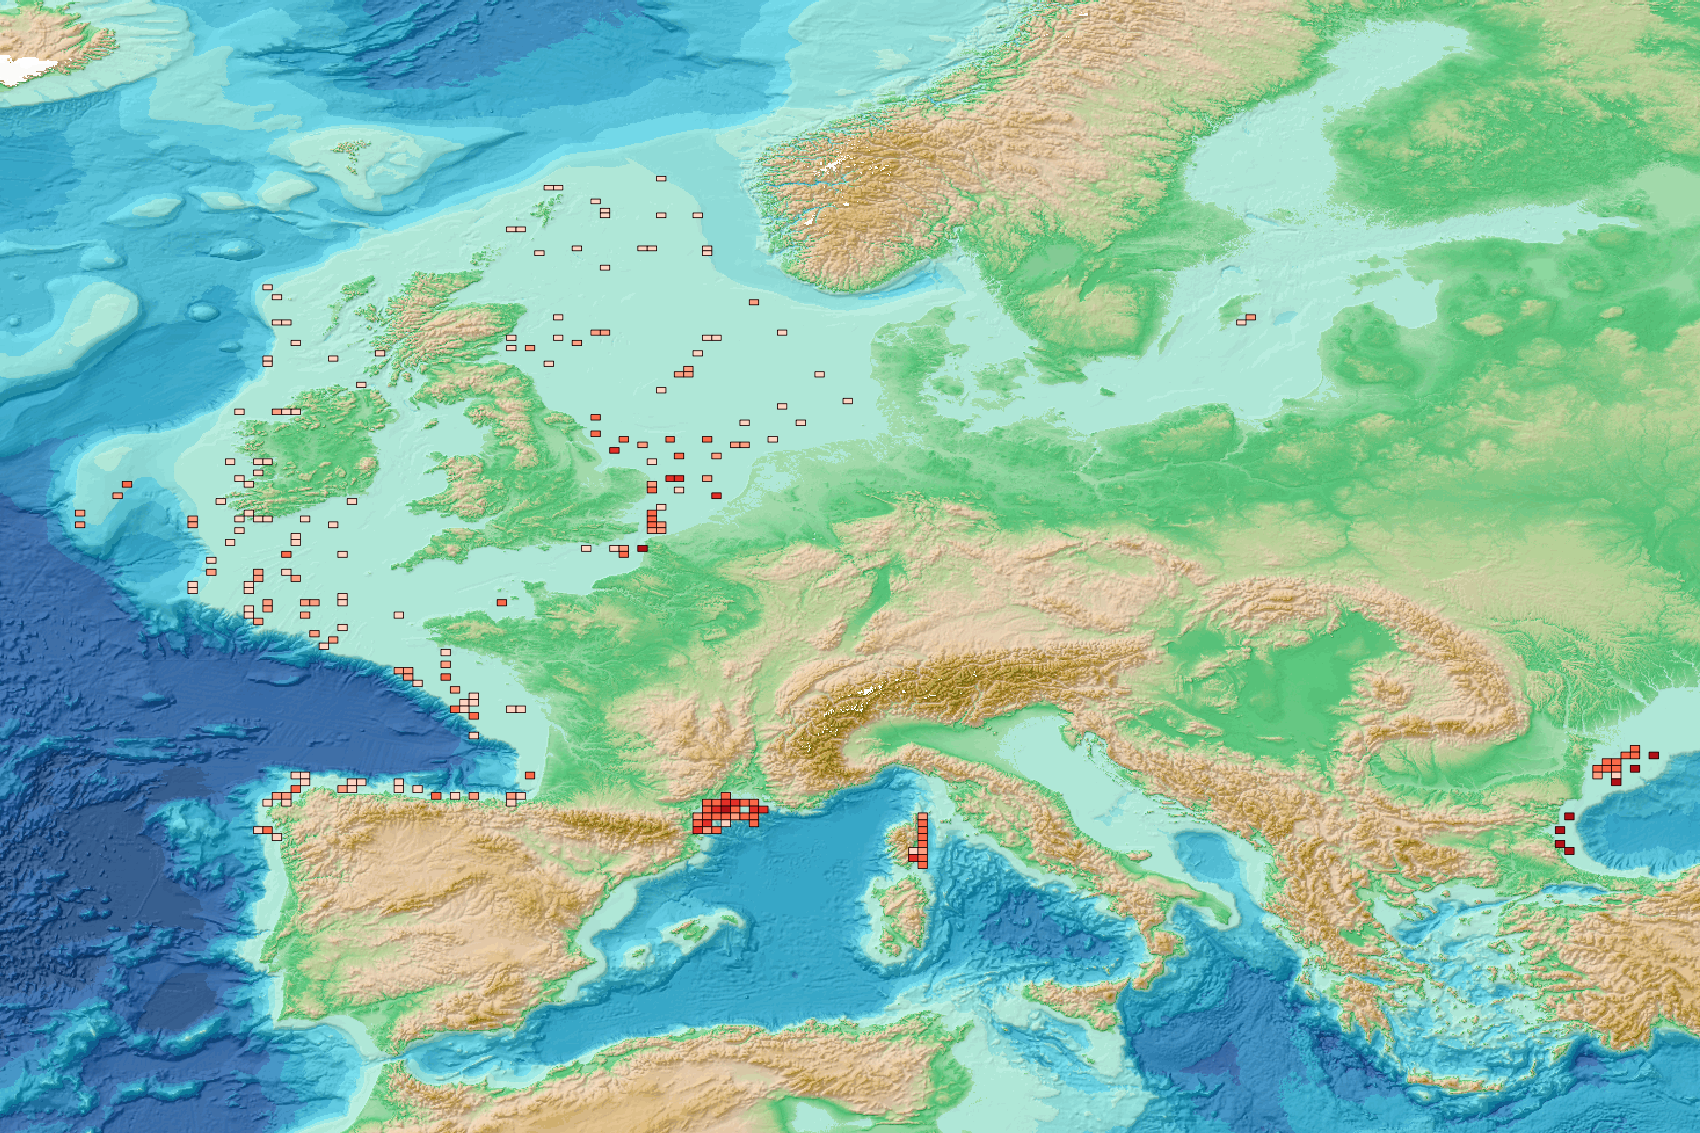
This visualization product displays the plastic bags abundance of marine macro-litter (> 2.5cm) per beach per year from non-MSFD monitoring surveys, research & cleaning operations. EMODnet Chemistry included the collection of marine litter in its 3rd phase. Since the beginning of 2018, data of beach litter have been gathered and processed in the EMODnet Chemistry Marine Litter Database (MLDB). The harmonization of all the data has been the most challenging task considering the heterogeneity of the data sources, sampling protocols and reference lists used on a European scale. Preliminary processing were necessary to harmonize all the data: - Exclusion of OSPAR 1000 protocol: in order to follow the approach of OSPAR that it is not including these data anymore in the monitoring; - Selection of surveys from non-MSFD monitoring, cleaning and research operations; - Exclusion of beaches without coordinates; - Selection of plastic bags related items only. The list of selected items is attached to this metadata. This list was created using EU Marine Beach Litter Baselines and EU Threshold Value for Macro Litter on Coastlines from JRC (these two documents are attached to this metadata); - Exclusion of surveys without associated length; - Normalization of survey lengths to 100m & 1 survey / year: in some case, the survey length was not 100m, so in order to be able to compare the abundance of litter from different beaches a normalization is applied using this formula: Number of plastic bags related items of the survey (normalized by 100 m) = Number of plastic bags related items of the survey x (100 / survey length) Then, this normalized number of plastic bags related items is summed to obtain the total normalized number of plastic bags related items for each survey. Finally, the median abundance of plastic bags related items for each beach and year is calculated from these normalized abundances of plastic bags related items per survey. Percentiles 50, 75, 95 & 99 have been calculated taking into account plastic bags related items from other sources data for all years. More information is available in the attached documents. Warning: the absence of data on the map doesn't necessarily mean that they don't exist, but that no information has been entered in the Marine Litter Database for this area.
-
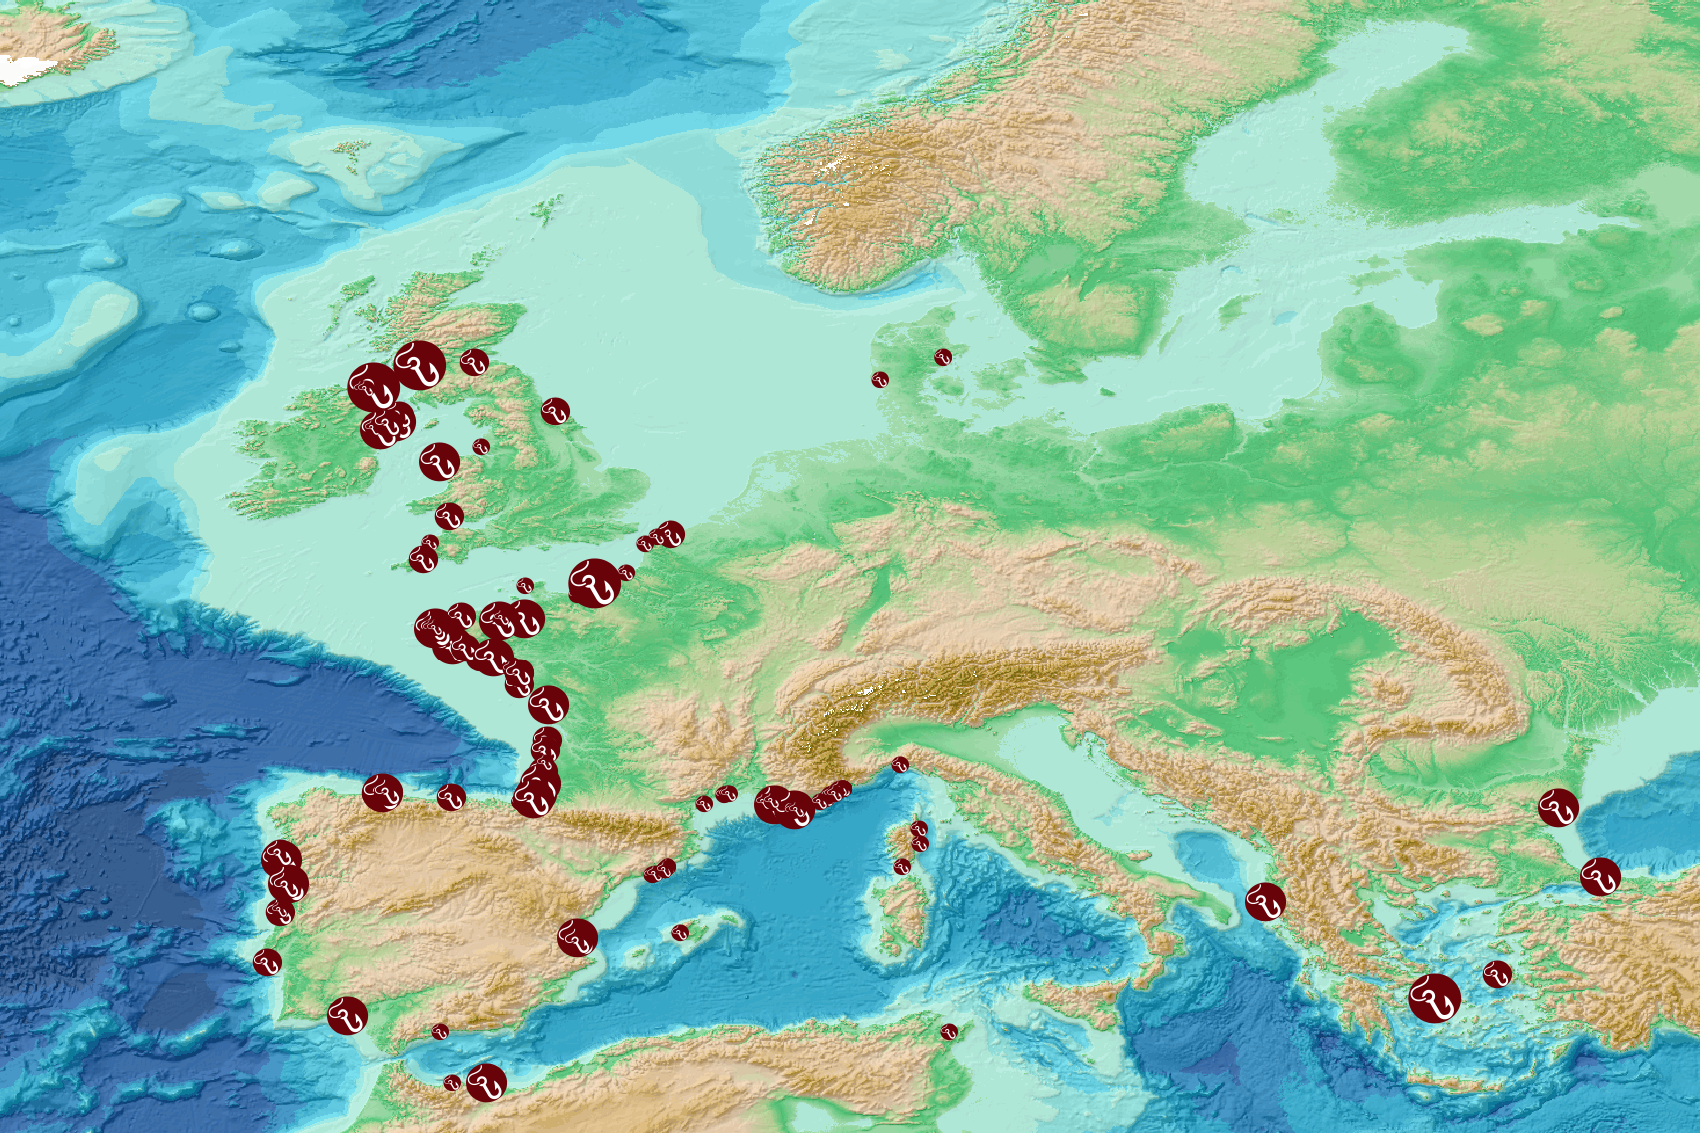
This visualization product displays the fishing & aquaculture related plastic items abundance of marine macro-litter (> 2.5cm) per beach per year from non-MSFD monitoring surveys, research & cleaning operations. EMODnet Chemistry included the collection of marine litter in its 3rd phase. Since the beginning of 2018, data of beach litter have been gathered and processed in the EMODnet Chemistry Marine Litter Database (MLDB). The harmonization of all the data has been the most challenging task considering the heterogeneity of the data sources, sampling protocols and reference lists used on a European scale. Preliminary processing were necessary to harmonize all the data: - Exclusion of OSPAR 1000 protocol: in order to follow the approach of OSPAR that it is not including these data anymore in the monitoring; - Selection of surveys from non-MSFD monitoring, cleaning and research operations; - Exclusion of beaches without coordinates; - Selection of fishing and aquaculture related plastic items only. The list of selected items is attached to this metadata. This list was created using EU Marine Beach Litter Baselines and EU Threshold Value for Macro Litter on Coastlines from JRC (these two documents are attached to this metadata); - Exclusion of surveys without associated length; - Normalization of survey lengths to 100m & 1 survey / year: in some case, the survey length was not 100m, so in order to be able to compare the abundance of litter from different beaches a normalization is applied using this formula: Number of fishing & aquaculture related plastic items of the survey (normalized by 100 m) = Number of fishing & aquaculture related items of the survey x (100 / survey length) Then, this normalized number of fishing & aquaculture related plastic items is summed to obtain the total normalized number of fishing & aquaculture related plastic items for each survey. Finally, the median abundance of fishing & aquaculture related plastic items for each beach and year is calculated from these normalized abundances of fishing & aquaculture related items per survey. Percentiles 50, 75, 95 & 99 have been calculated taking into account fishing & aquaculture related plastic items from other sources data for all years. More information is available in the attached documents. Warning: the absence of data on the map doesn't necessarily mean that they don't exist, but that no information has been entered in the Marine Litter Database for this area.
-
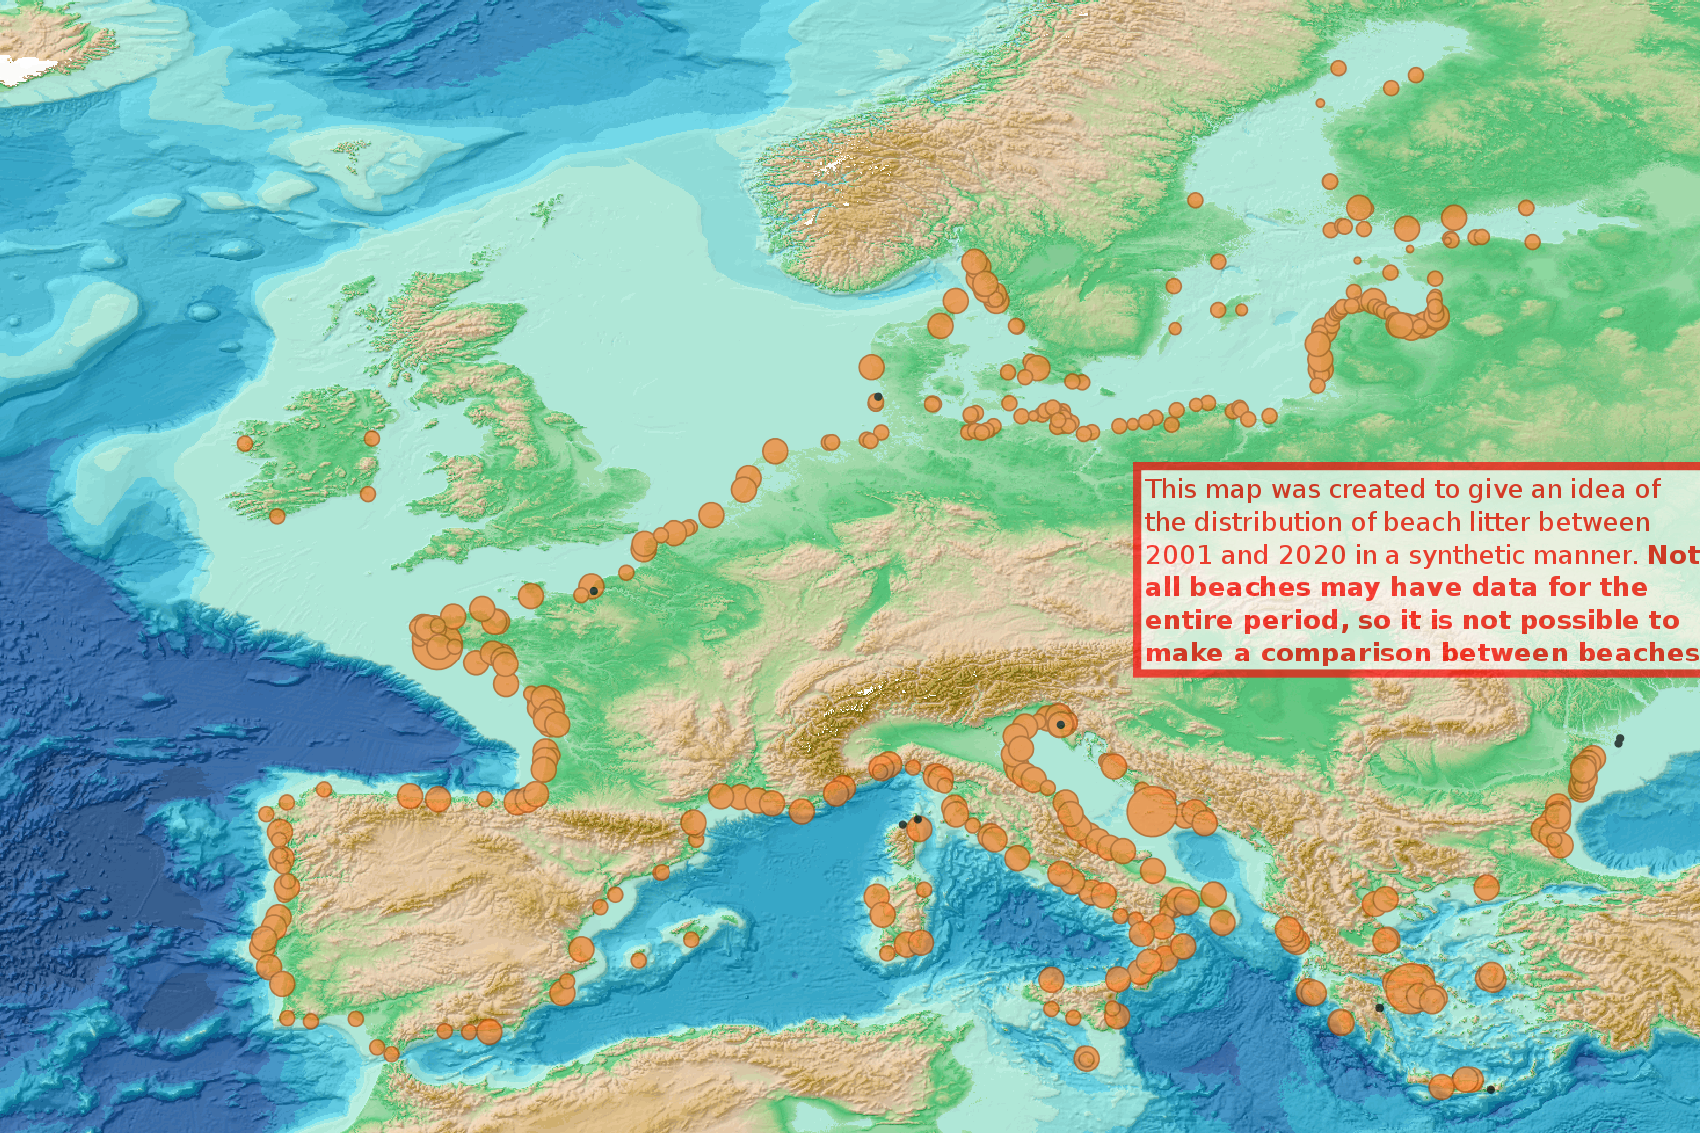
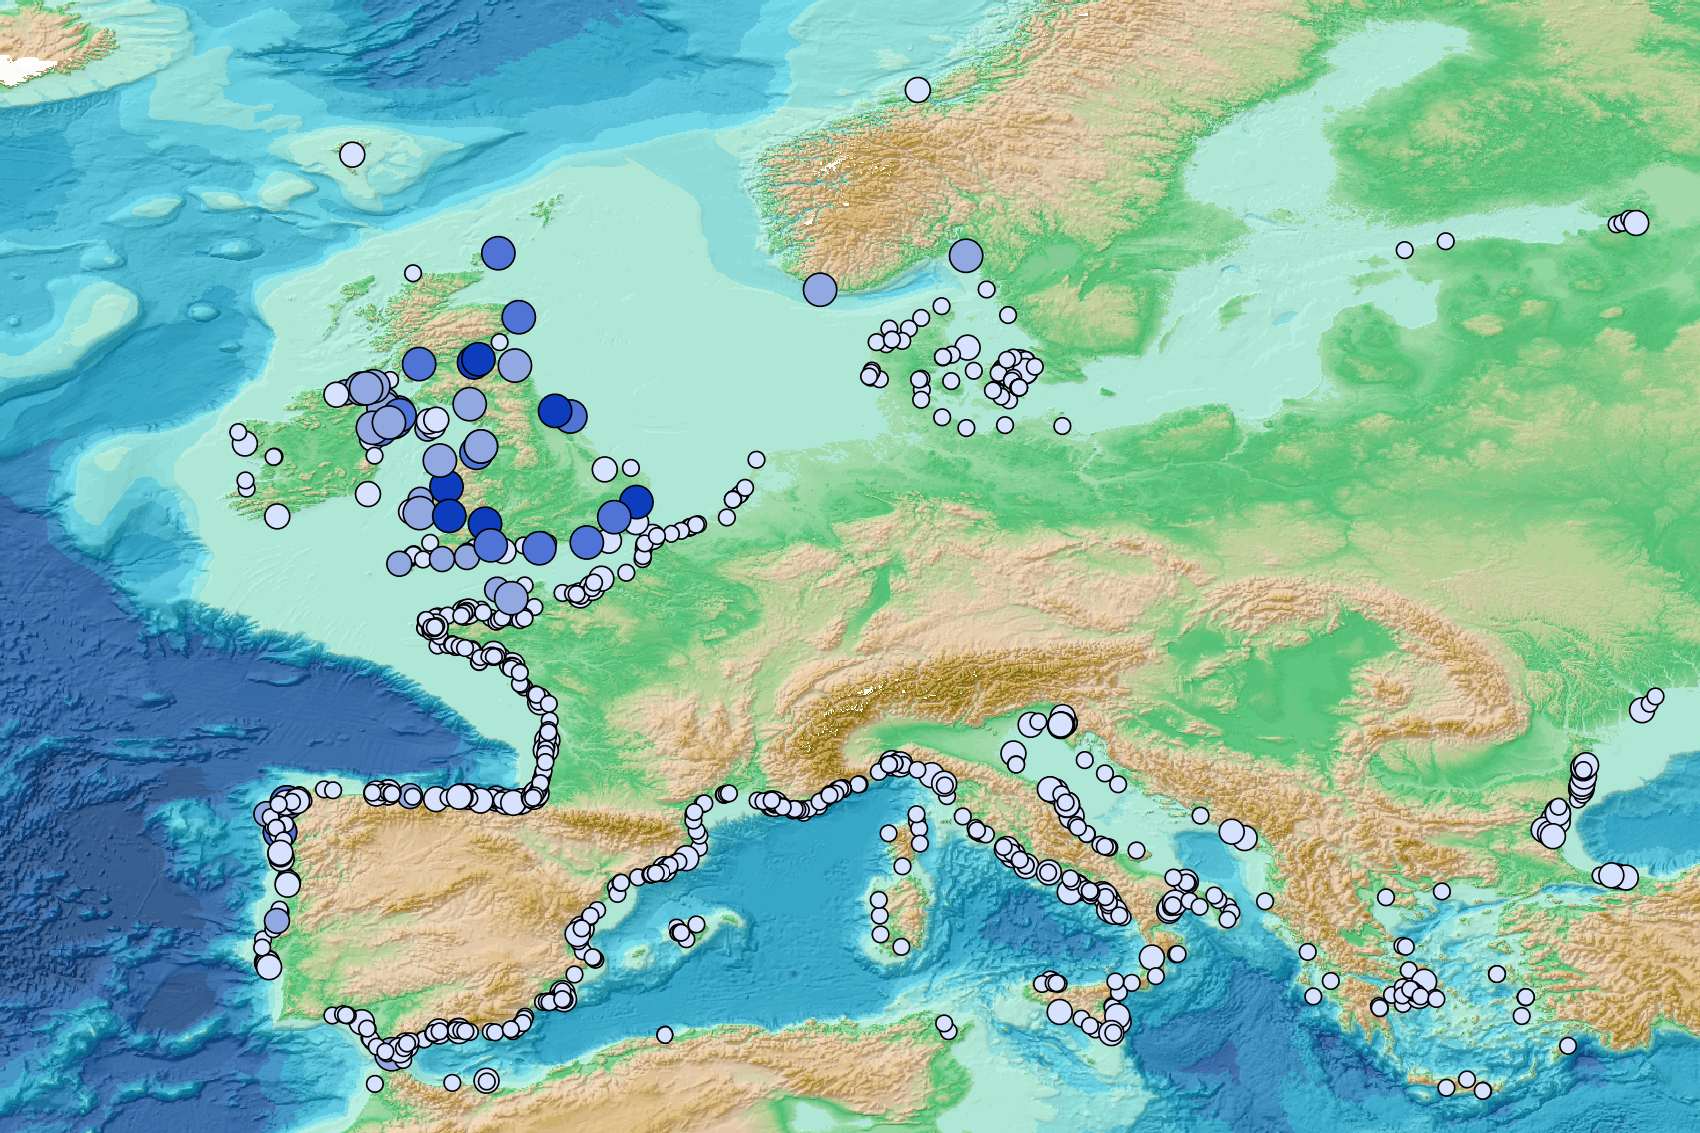
This visualization product displays the total abundance of marine macro-litter (> 2.5cm) per beach, per 100m & to 1 survey aggregated over the period 2001 to 2020 from Marine Strategy Framework Directive (MSFD) monitoring surveys. EMODnet Chemistry included the collection of marine litter in its 3rd phase. Since the beginning of 2018, data of beach litter have been gathered and processed in the EMODnet Chemistry Marine Litter Database (MLDB). The harmonization of all the data has been the most challenging task considering the heterogeneity of the data sources, sampling protocols and reference lists used on a European scale. Preliminary processing were necessary to harmonize all the data: - Exclusion of OSPAR 1000 protocol: in order to follow the approach of OSPAR that it is not including these data anymore in the monitoring; - Selection of MSFD surveys only (exclusion of other monitoring, cleaning and research operations); - Exclusion of beaches without coordinates; - Some categories & some litter types like organic litter, small fragments (paraffin and wax; items > 2.5cm) and pollutants have been removed. The list of selected items is attached to this metadata (total abundance list). This list was created using EU Marine Beach Litter Baselines and EU Threshold Value for Macro Litter on Coastlines from JRC (these two documents are attached to this metadata); - Normalization of survey lengths to 100m & 1 survey / year: in some cases, the survey length was not exactly 100m, so in order to be able to compare the abundance of litter from different beaches a normalization is applied using this formula: Number of items (normalized by 100 m) = Number of litter per items x (100 / survey length) Then, this normalized number of items is summed to obtain the total normalized number of litter for each survey. Finally, a median is calculated over the entire period among all these total numbers of litter per 100m calculated for each survey. Sometimes the survey length was null or equal to 0. Assuming that the MSFD protocol has been applied, the length has been set at 100m in these cases. The size of each circle on this map increases with the calculated median number of marine litter per beach, per 100m & to 1 survey. The median litter abundance values displayed in the legend correspond to the 50 and 99 percentiles and the maximum value. More information is available in the attached documents. Warning: - the absence of data on the map doesn't necessarily mean that they don't exist, but that no information has been entered in the Marine Litter Database for this area. - This map was created to give an idea of the distribution of beach litter between 2001 and 2021 in a synthetic manner. NOT ALL BEACHES MAY HAVE DATA FOR THE ENTIRE PERIOD, SO IT IS NOT POSSIBLE TO MAKE A COMPARISON BETWEEN BEACHES.